
Creating a Checklist Using Ebird and Excel
/CREATING A LOCAL CHECKLIST USING EBIRD AND EXCEL
In a couple of weeks we'll be visiting the Midwest Bird Symposium in Ohio from September 19-22. There are a lot of great speakers including Lang Elliott, Alvaro Jaramillo, and many other illustrious folks. Our talk will be on Saturday at 2:00. Here's the whole schedule. Of course there are lots of field trips and I believe we'll be working with the Zeiss trips some of the days. If you'd like the pre-made checklist we created for the Midwest Bird Symposium, click here to download it.
When we’re planning a birding or photo trip it is really helpful, for study purposes and overall planning, to have a checklist of the birds that can be expected at that specific destination. Fortunately, it’s fairly easy to do this using Cornell’s eBird database, which includes a large database of birder-reported sightings from all over the US.
This short article explains how to do this using eBird and Excel or any similar spreadsheet program. There are a couple of slightly technical steps in this process, but if you follow these steps carefully it’s actually easy and fast.
STEP 1: Go to eBird's Bar Charts
Go to www.eBird.org and choose the Explore Data tab, and then choose Bar Charts (shown here):

STEP 2: Choose the Location

Although it’s easiest to just choose a state, we get better, more relevant results when we narrow down the location as closely as we can to the exact spots we’ll be visiting.
To narrow the search you can use counties, birding hot spots or other important birding locations.

When using counties we use a state county map as a reference. These maps are easy to find using Google. Choosing one that has the cities is usually much easier if we’re not familiar with the counties of that state. In this case we'll choose Ottowa County (the event is in Lakeside, OH).
After selecting the location, we will have bar charts for all of the species reported in that state or county(s) for all months of the year.

We like to further narrow down the dates to more closely approximate when we’ll be visiting the area. Since migration and other timings vary it’s good to “pad” the date range a bit by adding a couple of weeks on either side of the trip date.

We often also narrow down the years of data, to avoid records of a Corn Crake seen in 1905..!
Of course we could now just print the bar charts and use these--there are some tips on how to do that at the bottom of this eBird link.
However, it can be easier to quickly scan if the data is in a more familiar format, with “C” for the most common birds, “U” for uncommon, etc.
STEP 3: Import eBird Data to Excel
To do this, we need to download the bar-chart data by going to the very bottom of the pages and clicking on DOWNLOAD HISTOGRAM DATA.
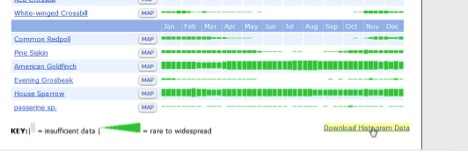
This action will save a file labeled “BarChart” on the desktop (or wherever the browser saves downloads).
To put this data in usable form we need to open this file in Excel using the OPEN command with “ALL FILES(*.*)” selected (since the download is not an excel file). Note the selection the mouse is making in this screenshot.

After locating the “BarChart” file to open, select YES-->NEXT-->NEXT-->FINISH for the open commands, which brings the file into Excel. It will look a bit geeky…but don’t worry: it will soon look familiar.
STEP 4: Clean up the Excel File
Since this file covers all dates (even though you choose a limited date range it shows all dates for those birds that could be in the area in your chosen date range) we like to delete the months we don’t care about for our trip. There are also some blank cells at the top that are good to delete as well.
Just select the rows or columns you don’t want and right click the mouse and choose DELETE (or choose DELETE from a menu).
This screenshot shows a number of unneeded rows being deleted.

This next screenshot shows a selection of unneeded date ranges being deleted.

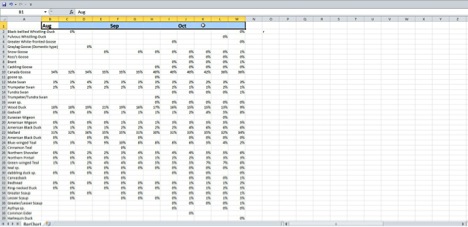
Now we have the dates and species for our trip, but the data is still a bit hard to decipher.
To make it easier, we can just format the data cells as PERCENTAGES.
To do this, select all of the date range columns and use HOME-->FORMAT-->FORMAT CELLS
Choose PERCENTAGE.


The results are a bit easier to understand:

The prior screenshot shows how the data looks as percentages, which is much easier to use.
It also shows the REPLACE menu. The data will look better by replacing all of the 0% with an empty cell.

So the above shot shows the replace menu with 0% as the “Find” and nothing as the “Replace with”
Here are the results:
The above format could be fairly useable as is. However there’s one more set of steps that makes it even easier to scan and use.
STEP 5: Convert Percentages to Common, Uncommon and Rare
Basically this step uses a formula that references the data for each of the above cells and converts that data to the common “C”, “U”, etc. codes from common checklists.
This step could seem tricky, but actually it’s pretty easy.
Here’s the formula:
=IF(B4>0.3,"C",IF(B4>0.2,"U",IF(B4>0.1,"P",IF(B4>0,"r"," "))))
Copy this formula into an open cell on the first species’ line. Here’s what it all means:

You can customize this as you’d like. You can change the
break points, add more letters, more levels of probability, such as “H” for “no
way in heck” for sightings below 5%, etc…
The breaks and the terms we’re using are totally arbitrary. The eBird data show the % of checklists that have included this species. More on what the data means is here.
To finish the conversion, just drag this formula to fill in the data for each line of the first species.

When you select a cell with the mouse on the lower RH edge it will turn into the “copy” function.
Just drag the mouse along the line to fill in the values for all of the months you’d like to use.
That fills in the data conversion for that species.

Now select all of the cells for that species, put the cursor at the bottom RH corner until it turns into the copy function, and drag all of the formulas down the whole spreadsheet to cover all of the other species.

This is much harder to explain than to do! The key is just to get that formula into the first cell and then drag copy it everywhere you need it. Excel takes care of making sure all of the references are correct.
You can then hide cells you don’t want, rearrange the data (carefully, so you don’t lose the references), remove species that are extremely rare, and customize as you’d like.
Here’s one way to format the checklist, showing the relative likelihood of seeing a species but preserving the percentages for reference:

Having a good checklist of an area we would plan on visiting can help make pre-trip study more efficient and, by comparing checklists from different regions, they can also help us plan which locations we want to target.
Once again, here's the Midwest Bird Symposium Checklist for anyone who's planning on attending...we hope to see you there!


